


Big data, a term increasingly prevalent in today's digital landscape, refers to the massive volumes of complex datasets that defy conventional data processing methods. Characterized by the three Vs Volume, Velocity, and Variety big data encompasses large-scale information streams from diverse sources like social media, sensors, and transactions. Managing, analyzing, and deriving insights from such data presents numerous challenges, including storage, processing, and ensuring data integrity. However, within these challenges lie significant opportunities.
Harnessing big data analytics can unlock valuable business insights, fuel innovation through predictive modelling and machine learning, and enable personalized customer experiences. Big data encompasses various types, each with its characteristics and challenges. Structured data, the most familiar type, resides in fixed fields within records and follows a predefined schema, making it easy to query and analyze. On the other hand, semi-structured data lacks a rigid schema and is often represented as key-value pairs, making it flexible but requiring serialization languages like XML, JSON, or YAML.
Unstructured data poses the most significant challenge, with no defined structure or rules, encompassing diverse forms like photos, videos, and text documents. Understanding these types—structured, semi-structured, and unstructured—is crucial for organizations seeking to effectively manage and analyze the vast amounts of data generated in today's digital age.
Big data refers to the massive volume of structured, semi-structured, and unstructured data that inundates organizations daily. It's characterized by its immense volume, velocity (speed at which data is generated), and variety (different types of data). This data comes from various sources, including sensors, social media posts, digital images, videos, transaction records, and more.
Due to its size and complexity, traditional data processing methods often need to be improved for handling big data. Therefore, specialized technologies and tools, such as distributed computing frameworks like Hadoop and data processing platforms like Apache Spark, have been developed to store, process, and analyze big data efficiently.
Big data analytics involves extracting valuable insights, patterns, and trends from large datasets to inform decision-making, improve business processes, and gain a competitive edge. It has applications across various industries, including finance, healthcare, retail, telecommunications, and manufacturing.

Big data refers to datasets that are massive in size, often too large to be processed using traditional database management tools. This volume can range from terabytes to petabytes or even exabytes of data. The sheer volume of data makes it challenging to store, process, and analyze using conventional methods.
These datasets are too vast to be managed and analyzed using traditional database tools. The sheer volume presents challenges in storage, processing, and analysis, requiring scalable infrastructure and specialized techniques to derive insights effectively.
Big data is generated at high velocity, meaning it is produced rapidly and continuously. This includes data generated in real-time or near-real-time from sources such as sensors, social media feeds, transactional systems, and website logs.
The velocity of data creation requires efficient processing and analysis techniques to derive actionable insights in a timely manner.These datasets are too vast to be managed and analyzed using traditional database tools. The sheer volume presents challenges in storage, processing, and analysis, requiring scalable infrastructure and specialized techniques to derive insights effectively.
Big data encompasses a wide variety of data types and formats, including structured, semi-structured, and unstructured data. This includes text documents, images, videos, social media posts, sensor data, log files, and more.
Managing and analyzing this diverse range of data requires flexible tools and techniques that can handle different formats and structures. This includes text, images, videos, sensor data, and more. Managing this variety requires flexible tools capable of handling different data formats and structures, along with advanced analytics techniques to extract meaningful insights from disparate sources.
Refers to the quality and reliability of the data. Big data sources often include noise, inconsistencies, and errors, requiring careful validation and cleansing to ensure accuracy and reliability. Ensuring data accuracy and reliability demands meticulous validation and cleansing processes.
By addressing these challenges, organizations can trust the data's integrity, enhancing the validity of insights derived from analysis.Big data often contains noise, inconsistencies, and errors, impacting its reliability.
Ultimately, big data should provide value to the organization. The insights derived from analyzing big data should lead to actionable decisions, improved processes, increased efficiency, and better outcomes.
Insights gleaned from analyzing big data should translate into actionable decisions, process enhancements, increased operational efficiency, and ultimately, better outcomes. By leveraging big data effectively, organizations can gain a competitive edge, drive innovation, and achieve their strategic objective.
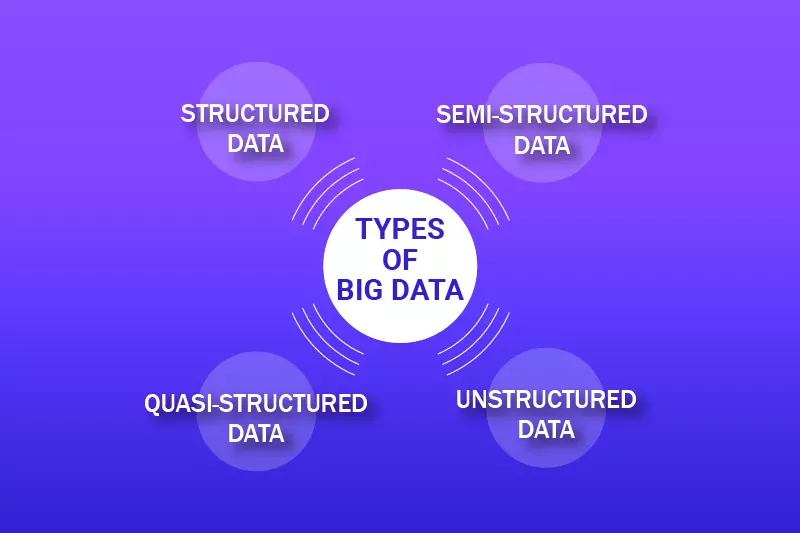
Big data encompasses vast amounts of information that can be broadly categorized into three main types based on structure and organization. Firstly, structured data is meticulously organized within predefined formats and fields, making it easily accessible and analyzable. Typically stored in databases or spreadsheets, structured data adheres to a strict schema, facilitating efficient querying and manipulation using tools like SQL.
Conversely, semi-structured data lacks the rigidity of structured data but retains some organization, often through tags or key-value pairs. Examples include JSON and XML files, frequently used for web data and metadata storage. Finally, unstructured data presents the most significant challenge, needing a more predefined structure or format.
This type includes free-form text, multimedia files, and sensor data, necessitating advanced analytics techniques such as machine learning and natural language processing for meaningful interpretation. Despite its complexities, unstructured data often harbours valuable insights crucial for informed decision-making. Overall, understanding and effectively managing these diverse types of big data are essential for organizations aiming to extract actionable insights and remain competitive in today's data-driven landscape.
Structured data refers to information organized within a predefined format, making it easily searchable, analyzable, and manageable. This data type is typically stored in databases or spreadsheets and follows a strict schema or model. Each structured data is divided into fields or attributes, allowing for efficient querying and manipulation using standard database query languages like SQL (Structured Query Language). Examples of structured data include numerical data, dates, strings, and other data types with a clear and consistent format.
Structured data is commonly found in various domains, including business, finance, healthcare, and research. For instance, structured data could include customer information, sales transactions, inventory records, and employee data in a business setting. Each data type follows a predefined structure, enabling organizations to organize and analyze their data efficiently.
Despite its advantages in terms of organization and accessibility, structured data also has its limitations. It may not be suitable for capturing complex relationships or unanticipated data types, and making changes to the structure can sometimes be cumbersome and time-consuming. Structured data remains a fundamental component of data management and analysis, forming the backbone of many data-driven applications and systems.
An example of structured data could be a database table containing information about employees in a company. Each row in the table represents a single employee, and each column represents a specific attribute or piece of information about that employee, such as their name, employee ID, department, salary, and hire date.
Here's how the structured data might look in a simplified table format.
In this example, each row represents a single employee, and each column represents a specific employee attribute. The structured data format allows for easy querying, sorting, and analysis using database management systems or other data processing tools.
Semi-structured data is a type of data that does not adhere to a rigid schema or predefined data model, yet it still exhibits some organizational properties. Unlike structured data stored in traditional relational databases, semi-structured data, such as fixed columns and data types, lacks a formal structure.
However, it does possess identifiable characteristics that enable partial organization, typically in the form of key-value pairs or hierarchical structures like JSON (JavaScript Object Notation) or XML (eXtensible Markup Language). This flexibility allows semi-structured data to accommodate varying data formats and types without needing a predefined schema.
It is well-suited for scenarios where data may be inconsistent or evolving, such as social media feeds, log files, or metadata-rich documents. Despite its looser structure than structured data, semi-structured data still offers opportunities for analysis and interpretation, albeit with different tools and approaches tailored to its unique format.
An example of semi-structured data could be a collection of customer reviews for products on an e-commerce platform. Each review may contain different fields, such as the reviewer's name, the product they purchased, the rating they gave, and their comments. While some reviews may include all these fields, others might only have a subset or be structured differently.
In this example, each review contains different fields; not all reviews have the same structure. Some reviews include all the expected fields (reviewer, product, rating, comment), while others might only have a subset (e.g., only the reviewer and comment). This variability in structure is characteristic of semi-structured data.
Quasi-structured data refers to data that falls somewhere between structured and semi-structured data in terms of organization and schema. Unlike structured data, which adheres to a rigid schema and is typically stored in relational databases, and semi-structured data, which lacks a formal schema but often exhibits some level of organization, quasi-structured data exhibits characteristics of both.
Quasi-structured data may have some semblance of organization, such as having identifiable fields or attributes, but it does not conform strictly to a predefined schema or format. This means that while there may be some consistency in how the data is structured, there is also a degree of flexibility and variability.
One typical example of quasi-structured data is stored in spreadsheets or CSV files. While these files may have columns and rows that suggest a structured format, they often allow for variability in terms of the types of data stored in each cell and additional metadata or annotations.
In this table, you can see that while there are standard fields like "Name" and "Email," the "Email" field for Alice is blank. Additionally, the "Feedback" field contains varying lengths and types of responses, demonstrating the quasi-structured nature of the data.
Unstructured data refers to data that needs a specific organizational structure or format, making it difficult to interpret using traditional data processing methods. This type of data is often in its raw form and needs to fit neatly into databases or spreadsheets. Examples of unstructured data include text documents, images, audio files, video files, social media posts, emails, and sensor data.
Unlike structured or semi-structured data, unstructured data does not adhere to a predefined schema or set of rules. It typically requires advanced analytical techniques, such as natural language processing, machine learning, or deep learning algorithms, to extract meaningful insights.
Unstructured data typically doesn't fit neatly into tables due to its lack of organization or structure. However, if we were to represent unstructured data in a table, it might look something like this, although it's a simplified and abstract representation:
In this table, each row represents a different document or piece of unstructured data, and the columns represent attributes such as Document ID and Text. However, it's important to note that unstructured data is often much more complex than what can be represented in a simple table, and its true value lies in its content and context rather than its structure.
This table compares the key characteristics and use cases of structured, semi-structured, and unstructured data, highlighting their differences in structure, storage, querying, analysis, flexibility, and example applications.
Big data, characterized by its vast volume, variety, and velocity, finds application across diverse sectors, revolutionizing traditional processes and unlocking new possibilities. In business analytics, companies harness big data to extract actionable insights from expansive datasets, informing strategic decisions.
Understanding customer behavior and market trends aids in gaining a competitive edge while optimizing operational processes drives efficiency and profitability. Healthcare sees a transformative impact as big data analyzes patient records, medical imaging, and genetic information, facilitating precise diagnoses, personalized treatment plans, and improved healthcare delivery.
Companies leverage big data to scrutinize vast datasets, extracting actionable insights for strategic decision-making. This includes understanding customer behavior market trends, and optimizing operational processes to gain a competitive edge.
Companies leverage big data to extract actionable insights from vast datasets, informing strategic decisions. Analyzing customer behavior and market trends enhances competitiveness while optimizing operational processes improves efficiency and profitability.
Big data transforms healthcare by analyzing patient records, medical imaging, and genetic information. It enhances diagnoses treatment plans, and facilitates personalized medicine, leading to better patient outcomes and more efficient healthcare delivery.
Big data revolutionizes healthcare by analyzing patient records, medical images, and genetics. This enables precise diagnoses, tailored treatment plans, and personalized medicine, resulting in improved patient outcomes and streamlined healthcare delivery.
In finance, big data powers fraud detection, risk management, algorithmic trading, and customer relationship management. Analyzing large volumes of financial data enables better decision-making, compliance, and market prediction.
Big data drives fraud detection, risk management, and algorithmic trading in finance. Analyzing financial data enhances decision-making, ensures regulatory compliance, and predicts market trends, optimizing performance and fostering customer relationships.
Online retailers utilize big data for personalized recommendations, targeted marketing, supply chain optimization, and dynamic pricing. Understanding customer preferences and behavior improves sales, customer satisfaction, and operational efficiency.
Online retailers harness big data for personalized recommendations, targeted marketing, and supply chain optimization. Understanding customer preferences drives sales and satisfaction while optimizing operations to improve efficiency and competitiveness.
Big data optimizes manufacturing processes by enabling predictive maintenance, quality control, and supply chain management. Analyzing production data improves efficiency, reduces downtime, and ensures product quality, driving competitiveness and profitability.
Big data enables predictive maintenance, quality control, and supply chain optimization in manufacturing. Analyzing production data minimizes downtime, ensures product quality, and enhances competitiveness and profitability.
Municipalities use big data for urban planning, traffic management, waste management, and public safety. Analyzing data from various sources enhances city infrastructure, resource allocation, and citizen services, creating sustainable and livable urban environments.
Municipalities leverage big data for urban planning and public service optimization. Analyzing data enhances infrastructure, traffic management, waste disposal, and public safety, fostering sustainable and livable urban environments.
Big data is a cornerstone of modern business and innovation, extending significantly across industries and sectors. By harnessing the vast volumes of daily data, organizations gain profound insights that fuel strategic decision-making, inform operational improvements, and drive innovation.
Through meticulous analysis, big data enables businesses to understand customer behavior, anticipate market trends, and tailor products and services to meet evolving demands.
Big data empowers organizations to make informed decisions by extracting insights from vast and varied datasets. These insights, derived through advanced analytics techniques, offer valuable information about market trends, customer behavior, and operational performance.
With a clearer understanding of their data, businesses can adapt quickly to changing market conditions, identify new opportunities, and mitigate risks more effectively, ultimately gaining a competitive edge in their industries.
By analyzing large volumes of data related to customer interactions, preferences, and feedback, big data enables organizations to understand their target audience better.
This insight allows for creating personalized marketing strategies, tailored product offerings, and improved customer service experiences. By delivering relevant and timely solutions, businesses can foster stronger customer relationships, increase satisfaction, and drive loyalty, ultimately leading to higher retention rates and long-term profitability.
Big data analytics helps organizations optimize their internal processes by identifying inefficiencies, automating repetitive tasks, and predicting maintenance needs. Businesses can streamline workflows, allocate resources more effectively, and reduce operational costs by analyzing data from various sources such as supply chain operations, production processes, and employee performance.
This increased efficiency improves productivity and enhances overall business performance, allowing organizations to stay competitive in today's fast-paced market environment.
Big data provides valuable insights into market dynamics, consumer preferences, and emerging trends, empowering organizations to innovate and develop new products and services. By analyzing large datasets, businesses can identify unmet needs, anticipate future demand, and uncover opportunities for differentiation.
This data-driven approach to innovation enables organizations to stay ahead of the competition, drive revenue growth, and build a reputation for delivering cutting-edge solutions that meet the evolving needs of their customers.
Big data analytics plays a crucial role in risk management and fraud detection across industries such as finance, healthcare, and cybersecurity. Organizations can identify potential risks, detect fraudulent activities, and mitigate threats to their operations and assets by analyzing patterns, anomalies, and outliers in large datasets.
This proactive approach to risk management helps businesses protect their bottom line, maintain regulatory compliance, and preserve customer trust, ultimately safeguarding their reputation and long-term viability in the market.
Big data accelerates scientific research and discovery by providing researchers with access to vast amounts of data from diverse sources. By leveraging advanced analytics techniques, scientists can analyze complex datasets, simulate intricate systems, and uncover patterns and correlations that would be impossible to detect through traditional methods.
This data-driven research approach enables breakthroughs in fields such as medicine, genomics, climate science, and astrophysics, driving innovation, advancing human knowledge, and addressing some of society's most pressing challenges.
Big data analytics helps organizations optimize resource management by providing insights into demand forecasting, supply chain optimization, and resource allocation. By analyzing energy consumption, transportation logistics, and agricultural production data, businesses can identify opportunities to reduce waste, improve efficiency, and minimize environmental impact.
This data-driven approach to resource management enhances sustainability, reduces costs, improves operational resilience, and ensures the responsible stewardship of natural resources for future generations.

Apache Hadoop is an open-source framework designed for distributed storage and processing of large datasets across commodity hardware clusters. It comprises two main components: Hadoop Distributed File System (HDFS) for scalable storage and MapReduce for parallel data processing.
Hadoop's HDFS stores data across multiple nodes in a cluster, providing fault tolerance and high availability. MapReduce enables distributed processing of large datasets by splitting them into smaller chunks and processing them in parallel across the cluster nodes.
Hadoop is commonly used for batch processing and analytics tasks, such as data warehousing, ETL (extract, transform, load) processes, and log processing. It offers scalability to handle massive volumes of data, fault tolerance to ensure data reliability, and cost-effectiveness by leveraging commodity hardware.
Apache Spark is a fast and versatile distributed computing engine for processing large-scale data. Unlike Hadoop's MapReduce, Spark performs in-memory processing, enabling faster execution of computations.
Spark supports many workloads, including batch processing, interactive queries, stream processing, machine learning, and graph processing. It provides high-level APIs in languages like Scala, Java, Python, and R and libraries such as Spark SQL for SQL-based queries, MLlib for machine learning, and GraphX for graph processing.
Spark's ability to perform real-time stream processing makes it suitable for applications requiring low-latency data processing, such as fraud detection, sensor data analysis, and real-time recommendations. Its flexibility, performance, and rich ecosystem of libraries make it a popular choice for big data analytics tasks.
Apache Kafka is a distributed streaming platform renowned for constructing real-time data pipelines and streaming applications. It facilitates seamless and fault-tolerant communication between systems, boasting high throughput for handling substantial volumes of data.
Kafka excels in scenarios requiring real-time processing of data streams, making it a staple in event-driven architectures, log aggregation systems, and data integration pipelines. Its architecture ensures reliability and scalability, crucial for mission-critical applications demanding continuous data ingestion and processing.
Elasticsearch is a distributed search and analytics engine tailored for various applications, from full-text search to log analysis and real-time data visualization. Its scalable architecture enables near-real-time indexing and search operations, making it ideal for use cases like log management, monitoring, and text-based search applications.
Elasticsearch excels in handling unstructured and semi-structured data, providing lightning-fast search capabilities across massive datasets. With its robust features and extensive ecosystem of plugins, Elasticsearch empowers organizations to derive valuable insights from their data, enhancing operational efficiency and decision-making processes.
Tableau is a leading data visualization tool for transforming complex datasets into interactive and insightful visualizations. Thanks to its intuitive drag-and-drop interface, users can effortlessly create dynamic dashboards and reports from significant data sources.
Tableau supports many data sources, enabling seamless connectivity and integration. Its popularity stems from its ease of use, allowing technical and non-technical users to explore data and generate compelling visualizations.
Moreover, Tableau's robust visualization capabilities enable users to uncover patterns, trends, and insights hidden within large datasets, facilitating data-driven decision-making across organizations.
QlikView and Qlik Sense are prominent business intelligence and data visualization platforms renowned for delivering dynamic and interactive visualizations from big data sources.
Utilizing an associative data model and in-memory processing, QlikView and Qlik Sense enable rapid and flexible analysis of large datasets. This approach allows users to explore data relationships intuitively and derive actionable insights efficiently.
With their interactive dashboards and visualization capabilities, users can gain deeper insights into their data, enabling informed decision-making and driving business growth. Both QlikView and Qlik Sense empower users to explore data in a self-service manner, fostering a data-driven culture within organizations.

Big data analytics encompasses a range of methodologies aimed at deriving insights from vast and complex datasets. Big data analytics encompasses various approaches and techniques for extracting insights from large and complex datasets.
Each type of big data analytics serves a unique purpose in extracting insights and driving decision-making processes. By leveraging these methodologies effectively, organizations can harness the power of big data to gain a competitive edge, optimize processes, and achieve their strategic objectives.
Descriptive analytics focuses on summarizing historical data to understand what has happened in the past. It involves data aggregation, mining, and visualization techniques to uncover patterns, trends, and correlations within the data.
Descriptive analytics provides valuable insights into past performance and helps organizations understand current affairs. It involves summarizing historical data to understand past events and trends.
Through data aggregation, mining, and visualization, organizations gain valuable insights into their past performance, enabling them to understand current situations better and make informed decisions.
Diagnostic analytics aims to answer why certain events occurred by identifying the root causes of past outcomes or events. It involves a deeper analysis of historical data to uncover relationships and dependencies between variables.
Diagnostic analytics often utilizes regression analysis, root cause analysis, and hypothesis testing to identify factors influencing outcomes and understand the underlying drivers behind observed patterns.
Seeks to understand why certain events occurred by delving deeper into historical data. This involves identifying root causes through regression analysis, root cause analysis, and hypothesis testing. By uncovering relationships and dependencies between variables, organizations can better understand the factors influencing outcomes.
Predictive analytics involves forecasting future outcomes or trends based on historical data and statistical modeling techniques. It uses advanced algorithms and machine learning models to analyze historical patterns and predict future events. Predictive analytics helps organizations anticipate potential outcomes, mitigate risks, and identify opportunities for optimization.
Typical applications include demand forecasting, predictive maintenance, and risk management. Focuses on forecasting future outcomes or trends based on historical data and statistical modeling techniques.
By leveraging advanced algorithms and machine learning models, organizations can analyze patterns in historical data to make predictions about future events. Predictive analytics enables businesses to anticipate potential outcomes, mitigate risks, and identify opportunities for optimization.
Prescriptive analytics goes beyond predicting future outcomes to recommend actions that organizations should take to achieve specific goals or objectives. It combines insights from descriptive, diagnostic, and predictive analytics with optimization and simulation techniques to generate actionable recommendations.
Prescriptive analytics helps organizations make informed decisions by providing recommendations on the best course of action to maximize desired outcomes. Applications include resource allocation, process optimization, and strategic planning.
The life cycle of big data analytics encompasses several crucial phases, each contributing to deriving insights and value from large datasets. It begins with data acquisition, gathering information from diverse sources and ensuring its relevance and quality. Subsequently, data preparation involves cleaning, transforming, and structuring raw data for analysis, ensuring consistency and usability.
In the exploration phase, analysts utilize visualization and statistical techniques to uncover patterns, trends, and relationships within the data, guiding further analysis and hypothesis generation. The modeling and analysis phase employs advanced techniques and algorithms to develop models and extract insights aligned with business objectives.
It involves gathering data from various sources, ensuring its relevance and quality before ingestion into the analytics environment, such as databases, sensors, and social media platforms.
The process begins with gathering data from various sources, including internal databases, external sources, sensors, social media, etc. This phase involves identifying relevant data sources, collecting raw data, and ingesting it into the analytics environment.
Raw data undergoes cleaning, transformation, and structuring to ensure consistency and usability, including tasks like data cleaning, integration, and formatting for subsequent analysis.
Once the data is acquired, it needs to be cleansed, transformed, and formatted to make it suitable for analysis. This involves data cleaning to remove errors and inconsistencies, data integration to combine data from different sources, and data transformation to convert it into a usable format.
Analysts utilize visualization and statistical techniques to explore data patterns, trends, and relationships, uncovering insights that guide further analysis and hypothesis generation for informed decision-making.
In this phase, analysts explore the prepared data better to understand its characteristics, patterns, and relationships. Data visualization techniques, statistical analysis, and exploratory data analysis (EDA) are commonly used to uncover insights and identify potential areas for further analysis.
Advanced analytics techniques and algorithms are applied to develop models and extract insights, encompassing descriptive, diagnostic, predictive, or prescriptive analytics aligned with business objectives.
This phase involves applying analytical techniques and algorithms to the prepared data to develop models and extract insights. Depending on the objectives of the analysis, this may include descriptive analytics, diagnostic analytics, predictive modeling, or prescriptive analytics.
Results are interpreted, evaluated, and validated against business goals, ensuring accuracy and relevance before deployment or decision-making.
This involves comparing the findings against business objectives, validating the accuracy of the models, and assessing the potential impact on decision-making. Once the analysis is complete, the results must be interpreted and evaluated to assess their validity, relevance, and implications.
Insights and recommendations are deployed into operational systems or presented to stakeholders for action, driving business value and informing strategic decisions. After the analysis is validated and approved, the insights and recommendations are deployed into operational systems or presented to stakeholders for decision-making.
This may involve integrating analytical models into production systems, implementing process changes based on recommendations, or communicating findings to relevant stakeholders.
Deployed solutions are continuously monitored, evaluated, and optimized to ensure ongoing effectiveness and alignment with evolving business objectives, enabling continuous improvement and innovation.
The final phase involves monitoring the performance of deployed models and solutions, measuring their effectiveness against predefined metrics, and continuously optimizing them to ensure they remain relevant and impactful. This may involve refining models, updating data sources, and adapting strategies based on feedback, and changing business requirements.
Big data practices continue to evolve, reflecting the ever-changing landscape of technology and business needs. Real-time data processing emerges as a dominant practice, empowering organizations to analyze data streams as they are generated.
Leveraging technologies like Apache Kafka and Apache Flink, businesses can make immediate decisions based on current information, enhancing agility and competitiveness.
Additionally, integrating AI and machine learning into big data analytics workflows becomes pervasive, enabling automated decision-making and uncovering valuable insights with greater accuracy.
In 2025, real-time data processing will be a crucial focus, enabling organizations to analyze data as it's generated. Technologies like Apache Kafka and Apache Flink will be utilized to ingest, process, and analyze streaming data in real-time.
This practice empowers businesses to make immediate decisions based on current information, enhancing agility, responsiveness, and competitiveness in dynamic environments.
Integrating AI and machine learning into big data analytics workflows will be pervasive. Organizations will leverage ML models for predictive analytics, anomaly detection, and pattern recognition to derive actionable insights from vast datasets.
This integration enables automated decision-making, enhances predictive capabilities, and uncovers valuable business insights with greater accuracy and efficiency.
With the proliferation of IoT devices, there will be a growing emphasis on managing and analyzing data at the network's edge. Edge computing technologies will enable organizations to process and analyze IoT data locally, reducing latency and bandwidth usage.
This practice facilitates real-time decision-making in IoT applications, enhances scalability, and improves data security by minimizing data transfer to centralized servers.
Organizations will prioritise robust data governance and compliance measures in response to increasing data privacy concerns and regulatory requirements.
This includes ensuring data quality, establishing clear data stewardship roles, and implementing stringent security measures to protect sensitive data. By maintaining compliance with regulations like GDPR and CCPA, organizations can mitigate risks, build trust with customers, and avoid costly penalties.
As organizations adopt hybrid and multi-cloud strategies, managing data across distributed environments will be crucial. This involves implementing data integration and management solutions capable of seamlessly handling data across on-premises infrastructure and multiple cloud platforms.
By leveraging hybrid and multi-cloud architectures, organizations can optimize resource utilization, enhance scalability, and ensure data accessibility while mitigating vendor lock-in risks.
The evolution of big data traces back to the early 2000s, marked by the exponential growth in digital data volumes generated by the internet, social media, sensors, and other sources. Initially, organizations needed help managing and analyzing these vast datasets using traditional database systems. This led to the development of new technologies and approaches to address the challenges posed by big data.
Around the mid-2000s, Google introduced two groundbreaking papers on Google File System (GFS) and MapReduce, laying the foundation for distributed storage and processing of large-scale data. These concepts inspired the creation of Apache Hadoop by Doug Cutting and Mike Cafarella in 2005, an open-source framework that enabled distributed computing on commodity hardware.
In the following years, Hadoop gained widespread adoption, serving as the backbone for storing and processing massive datasets across clusters of computers. The Hadoop ecosystem expanded rapidly with the emergence of various tools and frameworks to complement its core components. Apache Hive, Pig, and HBase were among the early additions, offering data warehousing, data processing, and real-time database capabilities, respectively.
By the early 2010s, big data had become a mainstream phenomenon, with organizations across industries investing in technologies and expertise to harness its potential. The proliferation of cloud computing further accelerated the adoption of big data analytics, enabling organizations to scale their infrastructure and resources on demand.
Big data analytics has evolved to encompass real-time processing, advanced analytics, and machine learning in recent years. Technologies like Apache Spark, Kafka, and Flink have emerged as alternatives to traditional batch processing, enabling organizations to derive insights from data streams in real-time. Additionally, artificial intelligence and deep learning advancements have opened new possibilities for analyzing and interpreting complex datasets, driving innovation in predictive analytics, personalized recommendations, and autonomous systems.
Looking ahead, the evolution of big data is expected to continue, fueled by emerging technologies like edge computing, quantum computing, and decentralized architectures. These developments promise to expand the capabilities of big data analytics further, enabling organizations to extract deeper insights, drive more informed decisions, and unlock new opportunities for growth and innovation.
Hadoop is an open-source distributed computing framework designed for storing and processing large volumes of data across clusters of commodity hardware. It was created by Doug Cutting and Mike Cafarella in 2005 based on Google's MapReduce and Google File System (GFS) papers. The key components of Hadoop include: HDFS is a distributed file system that stores data across multiple nodes in a Hadoop cluster.
It provides high-throughput access to data and ensures fault tolerance by replicating data blocks across multiple nodes. MapReduce is a programming model and processing engine used for distributed processing of large datasets in parallel. It divides the processing into two phases: the Map phase, where data is filtered and transformed, and the Reduce phase, where the results are aggregated. Hadoop enables organizations to store and process vast amounts of data efficiently, making it ideal for tasks like batch processing, data warehousing, log analysis, and more.
Its scalability, fault tolerance, and cost-effectiveness have made it a cornerstone of big data analytics infrastructure across industries. The Hadoop ecosystem has grown significantly, with various tools and frameworks built on top of the core Hadoop components, such as Apache Hive for data warehousing, Apache Spark for in-memory processing, and Apache HBase for real-time database operations.
In conclusion, big data represents a transformative force that has revolutionized how organizations operate and make decisions in the digital age. Its ability to process, analyze, and derive insights from vast and diverse datasets has unlocked many industry opportunities. From improving operational efficiency and customer experiences to driving innovation and competitive advantage, the advantages of big data are undeniable.
By harnessing the power of big data analytics, organizations can make informed decisions, anticipate future trends, and mitigate risks more effectively. Big data technologies' scalability, real-time insights, and predictive capabilities enable organizations to adapt to rapidly changing environments and stay ahead of the curve.
Copy and paste below code to page Head section
Big data refers to the large volume of structured, semi-structured, and unstructured data that inundates organizations on a daily basis. This data is characterized by its high velocity, variety, and volume, making it challenging to process and analyze using traditional methods.
The main characteristics of big data are often summarized using the 3Vs: Volume (the sheer amount of data), Variety (the diverse types and sources of data), and Velocity (the speed at which data is generated and processed). Veracity (the accuracy and reliability of data) and Value (the actionable insights derived from data) are sometimes included as additional Vs.
Big data can be classified into three main types: structured, semi-structured, and unstructured data. Structured data refers to organised data that follows a predefined schema, such as data in relational databases. Semi-structured data has some organization but does not conform to a rigid schema, often seen in formats like JSON or XML. Unstructured data lacks a predefined structure and includes formats like text documents, images, and videos.
Big data can be generated from various sources, including social media platforms, sensors and IoT devices, online transactions, mobile applications, web logs, and more. Any digital interaction or activity can contribute to the generation of big data.
Big data analysis involves using advanced analytics techniques and technologies to process, interpret, and derive insights from large and complex datasets. This can include techniques such as data mining, machine learning, natural language processing, and predictive analytics, among others.
The advantages of big data include improved decision-making based on data-driven insights, enhanced operational efficiency, better customer understanding and targeting, innovation through data-driven product development, and the ability to uncover hidden patterns and trends in data.


